











The Today section collects fixtures that kick off within the current 24 hours and shows what statistical models expect from each one. Figures can move as new information arrives, so a page opened in the morning may not look identical by evening.
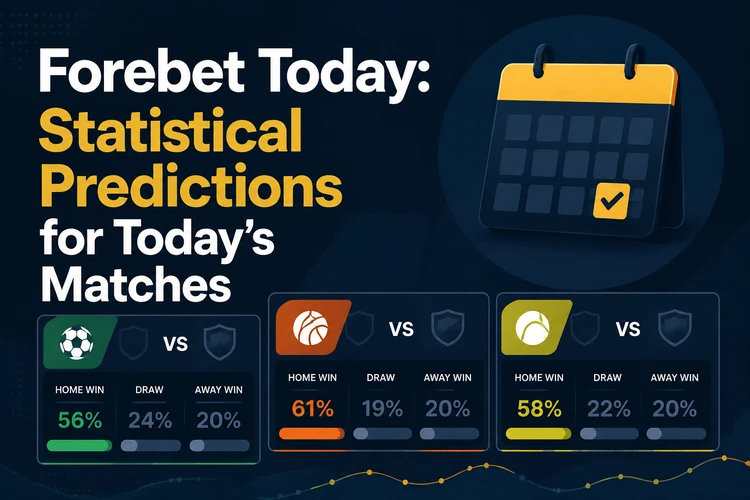
Coverage runs across football, basketball and tennis. Football carries the bulk of the daily list, while basketball and tennis add fixtures during their competitive seasons. The figures describe how likely each outcome appears from past data; they do not promise a result or replace independent judgement.
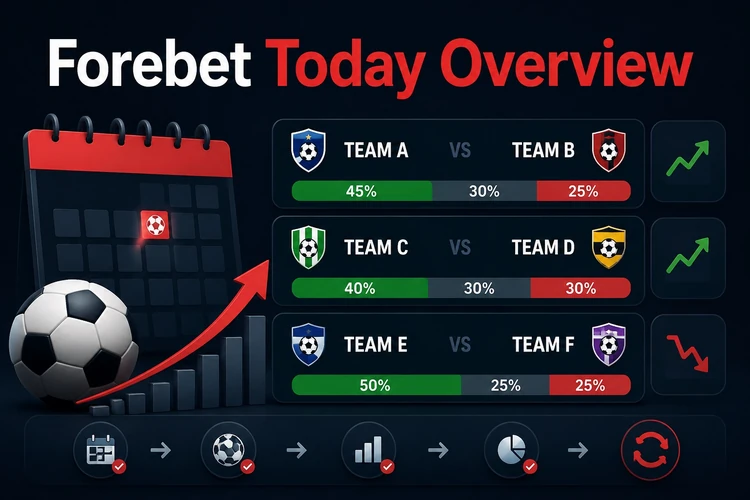
Forebet Today Overview
Each entry normally shows the teams or players, start time, competition, percentage split between possible outcomes and a projected score. Football rows may also include goal-line figures and an indication of whether both sides are expected to score.
Regular visitors may check the list when fixtures are published and again nearer to kick-off. Late team news, confirmed line-ups, postponed matches or newly added lower-division fixtures can affect what is displayed. A late fixture may appear only a few hours before it begins, particularly in smaller competitions.
Mathematical Predictions Explained
A statistical model uses past observations to estimate what may happen next. Common inputs include recent results, goals scored and conceded, home and away records, attacking and defensive efficiency, expected goals, head-to-head history and a rating that changes after each fixture.
The output is a probability rather than a verdict. If a home side is shown at 55 percent, the estimate suggests that the team would win slightly more often than not across many comparable fixtures. The remaining 45 percent still covers meaningful draw and away-win possibilities.
Models also have limits. They may not fully measure a dressing-room dispute, a long midweek journey, a poor playing surface or a manager resting key players before a cup tie. Those details are reasons to read the match context instead of treating a percentage as certainty.
Football Predictions Today
The football list can span major European leagues, second and third tiers, African domestic competitions, continental club tournaments, national cups, international windows and youth or reserve fixtures. Smaller competitions may have thinner samples, so recent changes in performance deserve particular attention.
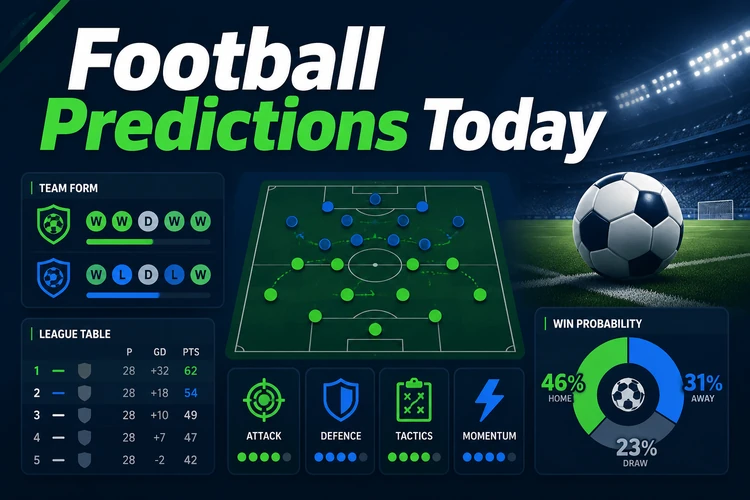
Comparing a full matchday is often more useful than examining one game alone. The same type of schedule is prepared for the next day on the fixtures scheduled for tomorrow, which can help when a Nigerian evening kick-off conflicts with work or travel.
Basketball and Tennis Predictions Today
Basketball analysis commonly considers scoring pace, offensive and defensive efficiency per possession, rebounding, turnovers and free-throw volume. Since games rarely finish level, the display usually focuses on two likely winners and a projected points total rather than a three-way result.
Back-to-back games, travel and a shortened rotation can change a basketball estimate. A team may have strong season numbers but look less reliable when several starters played heavy minutes the previous night. The sports coverage section provides a broader view of the available competitions.
Tennis coverage can include ATP and WTA tours as well as Challenger and ITF events. Surface is especially influential: a clay specialist and a fast-court server may have very different prospects when the venue changes. Ranking gaps, recent wins, service statistics and previous meetings are useful context, but they do not remove uncertainty.
Prediction Categories and Statistics
Different prediction categories answer different questions, so they should be read together rather than treated as interchangeable signals.
- Match Winner: the side with the highest estimated chance of winning in regular time.
- Draw: the estimated chance that a football fixture finishes level.
- Double Chance: two of the three regular-time results combined into one outcome.
- Both Teams To Score: the likelihood that each football side scores at least once.
- Over and Under Goals: whether total goals are expected above or below a stated line.
- Correct Score: the most probable exact scoreline, which usually has a modest percentage by itself.
- Probability Rating: an indication of how strongly the model favours its main outcome.
Supporting statistics include goals scored and conceded, clean sheets, separate home and away records, current winning or losing runs, draw percentage, head-to-head results and expected goals. A team with a strong home record and a weak away record has two different profiles, depending on the venue.
Reading the Numbers and Using Them Responsibly
Start with the probability split, then check whether the projected score supports it. A 2-1 projection beside a narrow win probability describes a close, open game. A 1-0 projection beside a higher probability suggests a more controlled fixture with fewer goals.

Form also needs context. Four straight wins against relegation candidates are not equivalent to two draws against title contenders, so check the quality of the opposition behind a recent run. When the score projection and probability point in different directions, treat the match as less settled.
These figures are analytical information, not advice or a guarantee. Sport remains unpredictable: injuries, refereeing decisions, weather and squad rotation can alter a result in ways that a model cannot fully capture. If betting is involved, use only money you can afford to lose, and remember that the service is intended for readers aged 18+. Further guidance is available in the responsible gambling information.
FAQ
The day's fixtures are published as they become available and figures may be refreshed when new data, confirmed times or additional matches arrive. Checking again nearer to kick-off can reveal changes.
It estimates how often an outcome might occur across many similar fixtures. A 60 percent home-win estimate favours that result, but the other 40 percent remains a substantial possibility.
Exact scorelines are difficult to predict, so even the leading score normally has a modest percentage. It is best used to understand the expected shape of a match, not as a firm forecast.
The general principle is similar, but the inputs differ. Basketball analysis emphasises pace and efficiency per possession, while tennis analysis gives more weight to surface, ranking, service statistics and player meetings.
Expected goals estimate the quality of chances created and allowed rather than counting only goals scored. They can show whether recent results reflect sustained chance creation or unusual finishing.
Yes. Reading the daily list league by league makes it easier to compare teams in the same competition, follow one tournament and avoid unrelated fixtures.